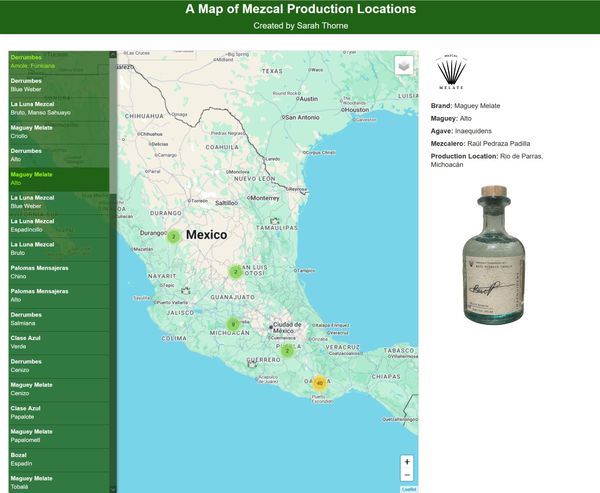
Mezcal Data Web Map
For my final project for GEOG 585, Open Web Mapping, I created a web map that shows where mezcals are produced.
Mezcal is growing in popularity in the US, and as a bartender at a mezcal bar I get asked “is mezcal from Mexico or is it produced here?” quite often. To be labeled “mezcal”, the spirit must be produced within one of nine specific states in Mexico: Oaxaca, Durango, Guerrero, Guanajuato, Michoacán, Puebla, San Luis Potosí, Tamaulipas, and Zacatecas. Listing the town of production, the person who made the batch, and the type of agave used on the bottle label is unique within the world of liquor. Including this information ties into the handcrafted nature of mezcal and serves as a way to honor those who made it, but it also helps mezcal drinkers identify specific bottles and batches. I thought making a map of where various mezcals come from would help provide some spatial context to mezcal fans and newcomers alike.
After collecting my data and learning how to utilize Leaflet, I decided to serve my data as a GeoJSON to be drawn by the browser. Given that all my data geometries are points and there are fewer than 100 points, serving this layer as WMS did not seem necessary. The browser could handle reading all the data and attributes in the GeoJSON quickly enough, and this way the end user could view details about each data point without having to make additional requests to the server. I also wanted to explore the interactivity and customizable plugin options that were available with Leaflet.
You can view the source code files here or visit the map here.
Check out the video below for a full demo.